
https://tryhackme.com/room/splunkdashboardsandreports
Created by: tryhackme, ryla
“Splunk is one of the most widely used Security Information and Event Management (SIEM) solutions in enterprise environments. It helps aggregate data from various data sources within an enterprise environment to enhance security monitoring. However, large volumes of data can quickly overwhelm analysts. In this room, you’ll learn practical ways to organize, visualize, and manage data in Splunk to make analysis faster, clearer, and more effective.”

Prerequisite rooms: https://tryhackme.com/room/splunk101 and https://tryhackme.com/room/splunkexploringspl.
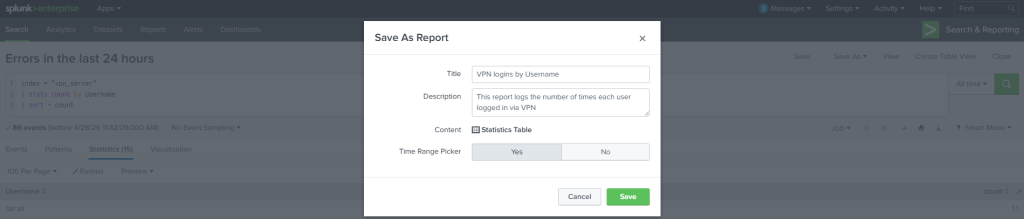
Task 2 has me creating a Splunk report. I apply the filter of index = vp_server | | stats count by Username | sort – count. Afterwards, I save this filter as a report.

“Head to the Splunk Reports tab and open the Web Connections by Source IP report.
Which Source_IP field value recorded the highest number of events?”

“While viewing the report above, click Edit → Open in Search to investigate the query behind the report. What is the flag value hidden within the search query?”

On to Task 3, Detecting With Alerts and Rules!
“So far, you’ve learned how to create basic reports to display and reference information quickly. But what if you wanted to be notified when a specific activity occurs? For example, multiple failed login attempts on a single endpoint or an external IP address trying to access an internal employee portal. In such cases, Splunk alerts can automatically detect these events and notify analysts in real time through the use of alerts.
Note: Due to the limitations of the free Splunk license, we cannot practice setting up alerts on the attached instance. However, you can follow along with the queries and screenshots to get some practice and learn how they’re set up.”
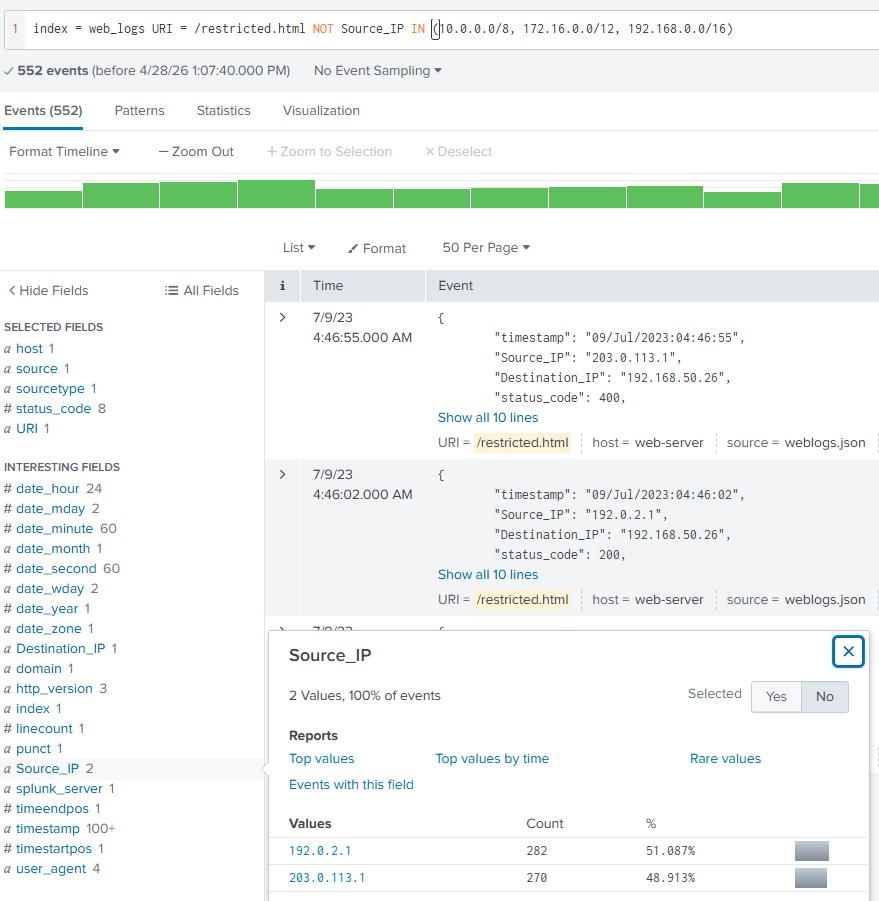
I’m unable to generate a report due to this limitation but I can still follow along. THM tasks me with using the following filter:index = web_logs URI = /restricted.html NOT Source_IP IN (10.0.0.0/8, 172.16.0.0/12, 192.168.0.0/16)

If I were able to save the alert, the workflow would look like:

THM has me type in the following(I could copy and paste, but I am choosing to type this out to get used to filtering on the spot).
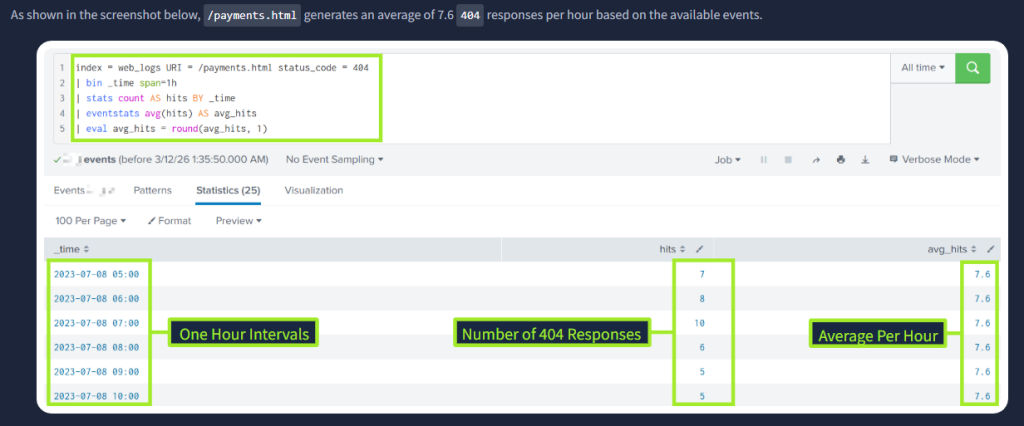
“The query below searches the web_logs index for status_code 404. It first groups events into 1-hour intervals, counts the number of events, and then calculates the average to one decimal, providing a baseline.”index = web_logs URI = /payments.html status_code = 404| bin _time span=1h| stats count AS hits BY _time| eventstats avg(hits) AS avg_hits| eval avg_hits = round(avg_hits, 1)
And if we wanted to get more specific.

“How many Source_IP addresses outside of the expected range accessed /restricted.html?’
I applied the filter from before and looked at the “Source_IP” field and see 2 values.
“How many total 404 status_code were recorded at /payments.html?”

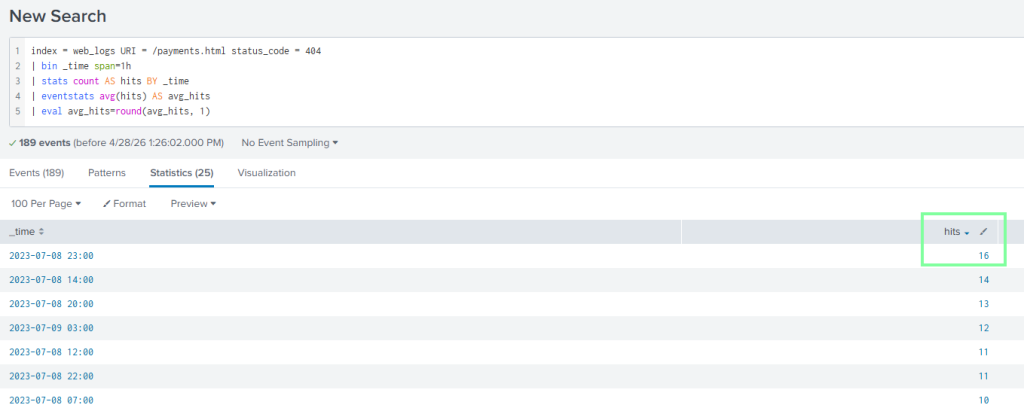
What is the highest number of 404‘s received in a given hour with the data available?”
Applying the same filter as before and clicking on “hits” to have the highest number filter to the top.
On to Task 4, Creating Dashboards for Summarizing Results!
“Within Splunk, dashboards provide users with quick access to information about the data present in Splunk. Dashboards are often created to give a summarized overview of selected important fields and statistics of event data. You may want to make a dashboard that displays the number of incidents within a specified time frame, such as identifying spikes or dips in specific events. Similar to reports, if you navigate to the Dashboards tab in Splunk, you will see a list of default dashboards provided, as well as the one we will be using in this task: Web Logs Overview.”
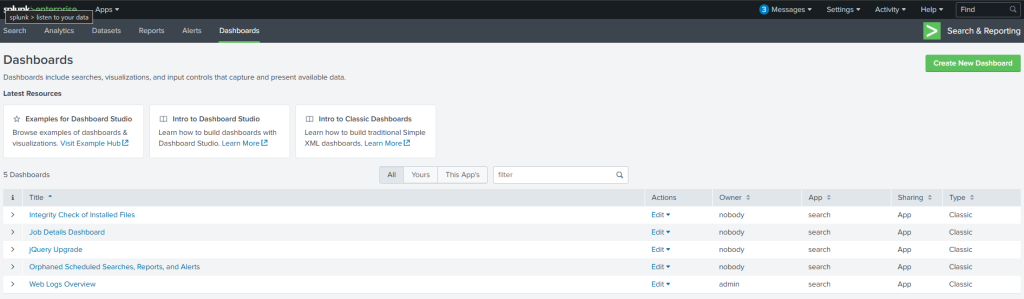
“Aside from choosing an existing dashboard, you have the option to create a new one in which you must assign a title, provide an optional description, adjust the permissions, and decide whether to use Classic Dashboards or Dashboard Studio.
Dashboard Studio is Splunk’s newer dashboard builder, designed to provide users with greater customization options in exchange for a complex learning curve. Classic Dashboards, on the other hand, remain the most commonly encountered format and fully support all standard visualizations. In this room, we will cover Classic Dashboards.”

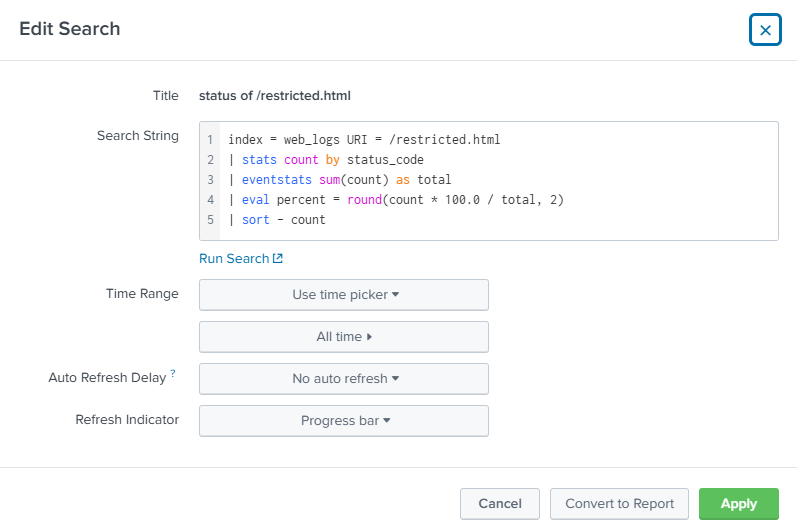
THM has me use this filter and breaking it down…index = web_logs URI = /restricted.html | stats count by status_code| eventstats sum(count) as total| eval percent = round(count * 100.0 / total, 2) | sort - count
And breaking it down in order
1. Search web logs for requests to /restricted.html
2. Count how many times each HTTP status code appears
3. Calculate total number of all requests and add to every row
4. Calculate what percentage each status code represents, rounded to 2 decimals
5. And lastly, Sort results by count in descending order (highest first).
“Inspect the URI pie chart you built in the dashboard above.
Which URI field value has the least amount of events present?”

“Add another statistics table to your dashboard to view the Source_IP, URI, and status_code fields. How many times did 172.16.0.1 receive the status_code 200 from /payments.html?”

Task 5 shows the strength of Splunk’s functionality. I’m unable to use this in the lab environment but they show screenshots of what Splunk can do on enterprise systems and briefly cover Enterprise Security, UEBA, and SOAR workflow.


“Which feature in Splunk Enterprise Security provides visibility into SOC efficiency and performance?”
The SOC Operations view below helps teams understand their overall efficiency, workload distribution, and where bottlenecks may be forming, ensuring incidents are not only detected but handled quickly and consistently.
“What does Splunk SOAR use to automate response actions based on conditions, filters, and decision logic?”
While analysts manually investigate alerts, check IP reputation, isolate hosts, or disable accounts, SOAR can perform these actions automatically through the use of playbooks that integrate with industry security tools.