https://tryhackme.com/room/volatility
Created by: tryhackme
“Volatility is a free memory forensics tool developed and maintained by Volatility Foundation, commonly used by malware and SOC analysts within a blue team or as part of their detection and monitoring solutions. Volatility is written in Python and is made up of python plugins and modules designed as a plug-and-play way of analyzing memory dumps.
Volatility is available for Windows, Linux, and Mac OS and is written purely in Python.”

“From the Volatility Foundation Wiki, ‘Volatility is the world’s most widely used framework for extracting digital artifacts from volatile memory (RAM) samples. The extraction techniques are performed completely independent of the system being investigated but offer visibility into the runtime state of the system. The framework is intended to introduce people to the techniques and complexities associated with extracting digital artifacts from volatile memory samples and provide a platform for further work into this exciting area of research.’
At the time of writing, there are two main repositories for Volatility; one built off of python 2 and another built off python 3. For this room, we recommend using the Volatility3 version build off of python 3. https://github.com/volatilityfoundation/volatility3
THM was nice enough to have a full step by step guide on how to install Volatility on Windows, Linux or Mac.
“To obtain a pre-packaged executable, simply download a zip file containing the application from their releases page. https://github.com/volatilityfoundation/volatility3/releases/tag/v1.0.1(opens in new tab)
To begin running the project from source, you will need to first download the following dependencies: Python 3.5.3 or later and Pefile 2017.8.1 or later. https://pypi.org/project/pefile/(opens in new tab)
You can also download these optional dependencies (recommended for this room): yara-python 3.8.0 or later https://github.com/VirusTotal/yara-python(opens in new tab) and capstone 3.0.0 or later https://www.capstone-engine.org/download.html(opens in new tab).
Once you have your dependencies sorted, you can clone the repository from GitHub.
Command used: git clone https://github.com/volatilityfoundation/volatility3.git
You now have Volatility installed!
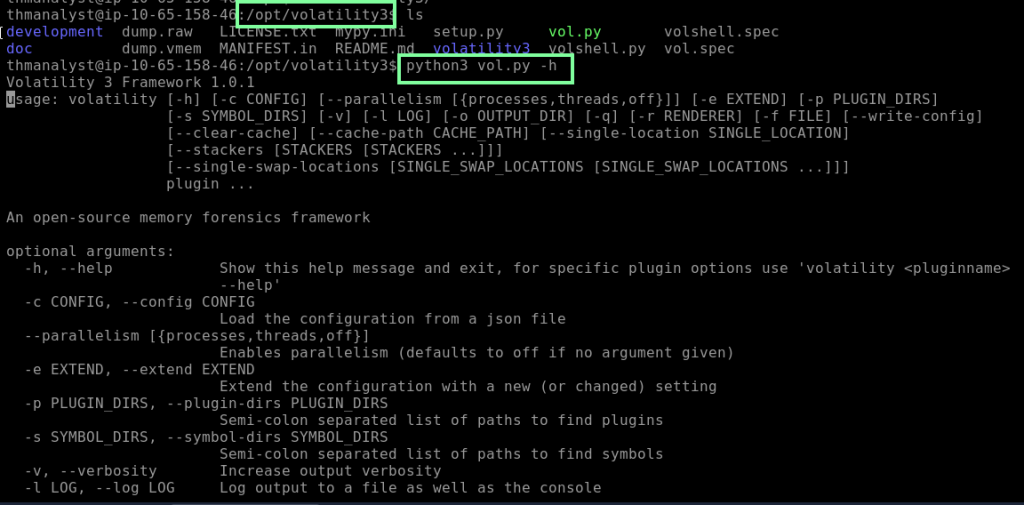
To test your installation run the vol.py file with the help parameter.
Command used: python3 vol.py -h
It is important to note that for any Linux or Mac memory files, you will need to download the symbol files from the Volatility GitHub. https://github.com/volatilityfoundation/volatility3#symbol-tables“
Don’t forget to change directories in order to use the command correctly.
I will be using the VM and Volatility 3 that is installed on the Ubuntu machine. Task 4 briefly goes over tooks that can be used to extract memory from bare-metal hosts, including FTK Imagine, Redline, DumpIt.exe, wind32/64dd.exe, Memoryze, and Fast Dump. In task 5, THM briefly covers plugins. Running the python3 vol3 -h command, scroll down and you will see a list of plugins available to use.

You will be using python3 vol.py -f /Scenarios/Investigations/Investigation-2.raw windows. for the rest of this task and altering it slightly.
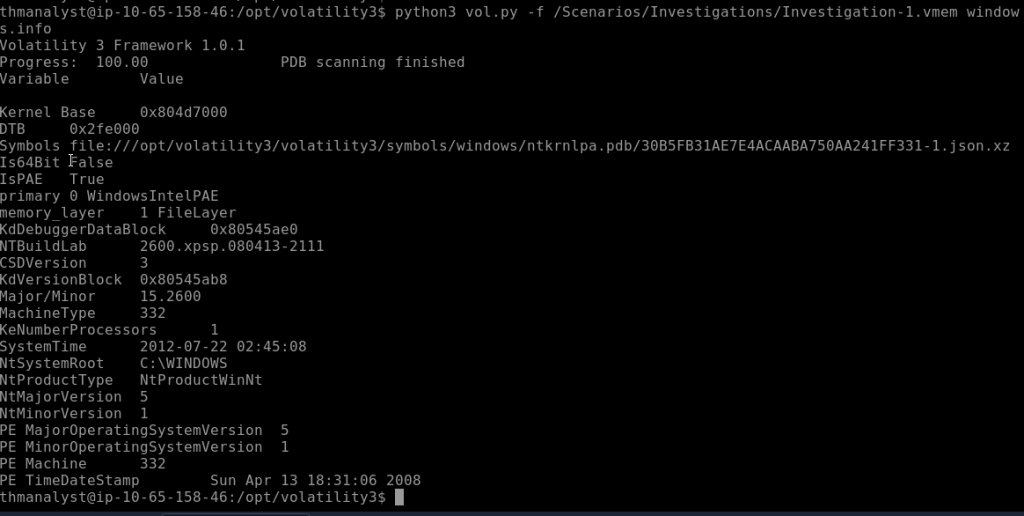
You can use windows.info, linux.info, or mac.info to see the OS specifics of the machine. They do confirm this can be incorrect, so triple-check your work when doing this. In the VM, running the command python3 vol.py -f /Scenarios/Investigations/Investigation-1.vmem windows.info yields the following OS information.
Tasks 7, 8, and 9 cover the use of Volatility. Task 7 is Listing Process and Connections. In order to cover everything and for the sake of keeping notes, the whole bulk of what is given is very helpful. I followed each syntax that was given and used it in the VM. See below for the snippets of each command input and output.
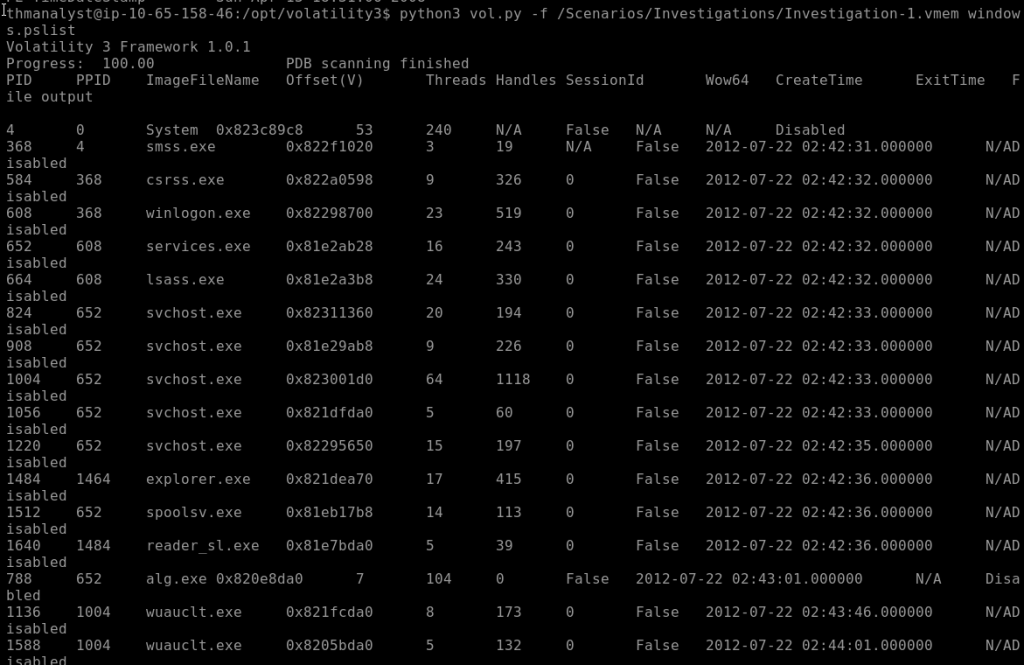
“The most basic way of listing processes is using pslist; this plugin will get the list of processes from the doubly-linked list that keeps track of processes in memory, equivalent to the process list in task manager. The output from this plugin will include all current processes and terminated processes with their exit times.
Syntax: python3 vol.py -f <file> windows.pslist“
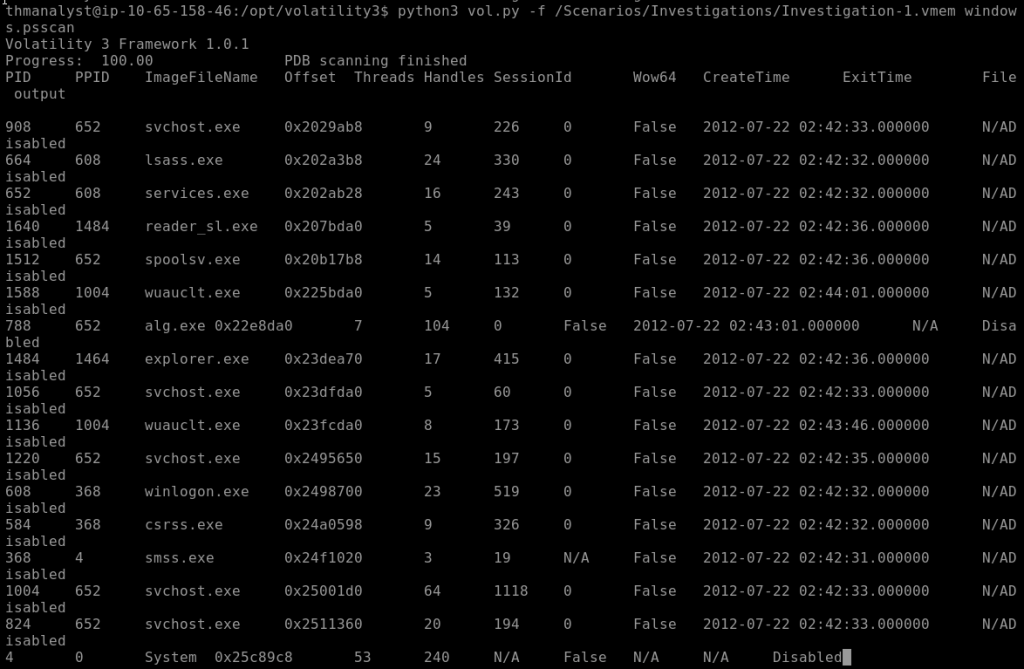
“Some malware, typically rootkits, will, in an attempt to hide their processes, unlink itself from the list. By unlinking themselves from the list you will no longer see their processes when using pslist. To combat this evasion technique, we can use psscan;this technique of listing processes will locate processes by finding data structures that match _EPROCESS. While this technique can help with evasion countermeasures, it can also cause false positives.
Syntax: python3 vol.py -f <file> windows.psscan“
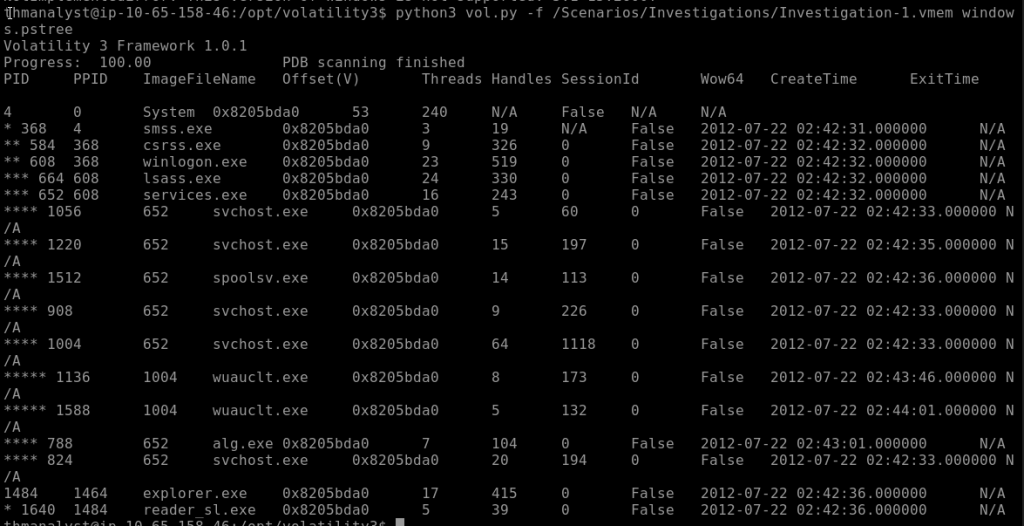
“The third process plugin, pstree, does not offer any other kind of special techniques to help identify evasion like the last two plugins; however, this plugin will list all processes based on their parent process ID, using the same methods as pslist. This can be useful for an analyst to get a full story of the processes and what may have been occurring at the time of extraction.
Syntax: python3 vol.py -f <file> windows.pstree“
“Now that we know how to identify processes, we also need to have a way to identify the network connections present at the time of extraction on the host machine. netstat will attempt to identify all memory structures with a network connection.
Syntax: python3 vol.py -f <file> windows.netstat"
We do see that this command is unstable with this version.
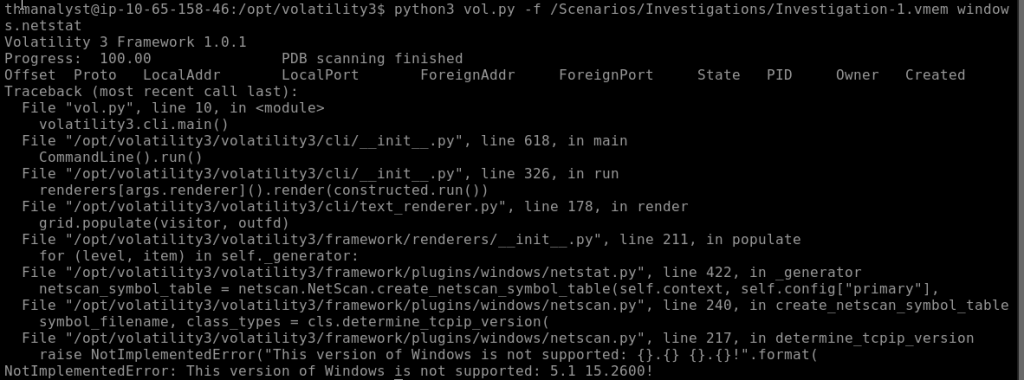
This command in the current state of volatility3 can be very unstable, particularly around old Windows builds. To combat this, you can utilize other tools like bulk_extractor to extract a PCAP file from the memory file. In some cases, this is preferred in network connections that you cannot identify from Volatility alone. https://tools.kali.org/forensics/bulk-extractor(opens in new tab)
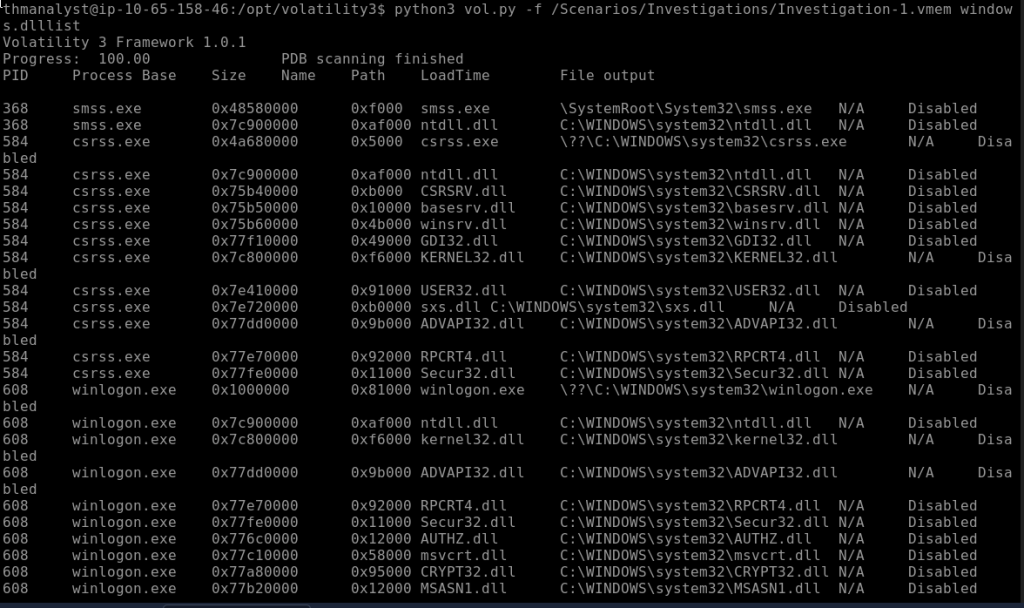
The last plugin we will cover is dlllist. This plugin will list all DLLs associated with processes at the time of extraction. This can be especially useful once you have done further analysis and can filter output to a specific DLL that might be an indicator for a specific type of malware you believe to be present on the system.
Syntax: python3 vol.py -f <file> windows.dlllist“
On to task 8, Volatility Hunting and Detection Capabilities!
“The first plugin we will be talking about that is one of the most useful when hunting for code injection is malfind. This plugin will attempt to identify injected processes and their PIDs along with the offset address and a Hex, Ascii, and Disassembly view of the infected area. The plugin works by scanning the heap and identifying processes that have the executable bit set RWE or RX and/or no memory-mapped file on disk (file-less malware).
Based on what malfind identifies, the injected area will change. An MZ header is an indicator of a Windows executable file. The injected area could also be directed towards shellcode which requires further analysis.
Syntax: python3 vol.py -f <file> windows.malfind“

“Volatility also offers the capability to compare the memory file against YARA rules. yarascan will search for strings, patterns, and compound rules against a rule set. You can either use a YARA file as an argument or list rules within the command line.
Syntax: python3 vol.py -f <file> windows.yarascan“
This does not work with the current file.

On to Taks 9, Advanced Memory Forensics.
“The first evasion technique we will be hunting is hooking; there are five methods of hooking employed by adversaries, outlined below:
SSDT Hooks
IRP Hooks
IAT Hooks
EAT Hooks
Inline Hooks
We will only be focusing on hunting SSDT hooking as this one of the most common techniques when dealing with malware evasion and the easiest plugin to use with the base volatility plugins.
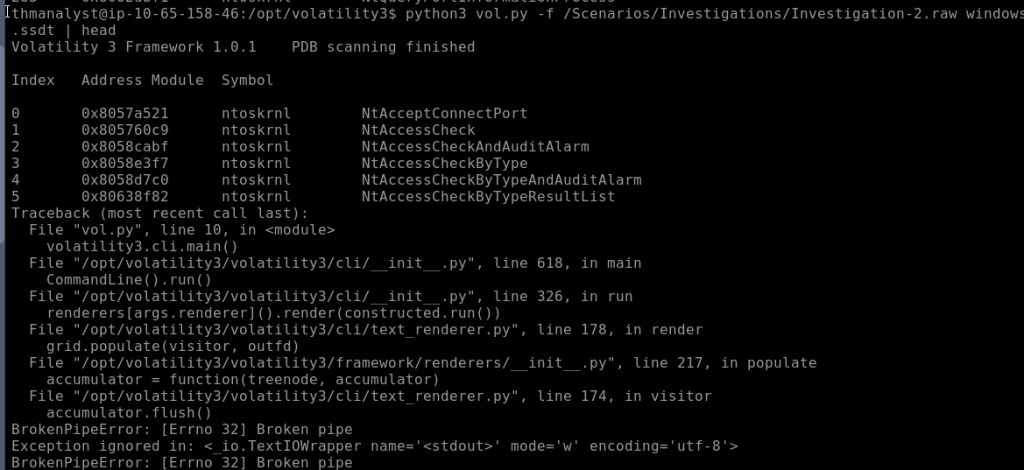
The ssdt plugin will search for hooking and output its results. Hooking can be used by legitimate applications, so it is up to you as the analyst to identify what is evil. As a brief overview of what SSDT hooking is: SSDT stands for System Service Descriptor Table; the Windows kernel uses this table to look up system functions. An adversary can hook into this table and modify pointers to point to a location the rootkit controls.
There can be hundreds of table entries that ssdt will dump; you will then have to analyze the output further or compare against a baseline. A suggestion is to use this plugin after investigating the initial compromise and working off it as part of your lead investigation.
Syntax: python3 vol.py -f <file> windows.ssdt“
“Adversaries will also use malicious driver files as part of their evasion. Volatility offers two plugins to list drivers.
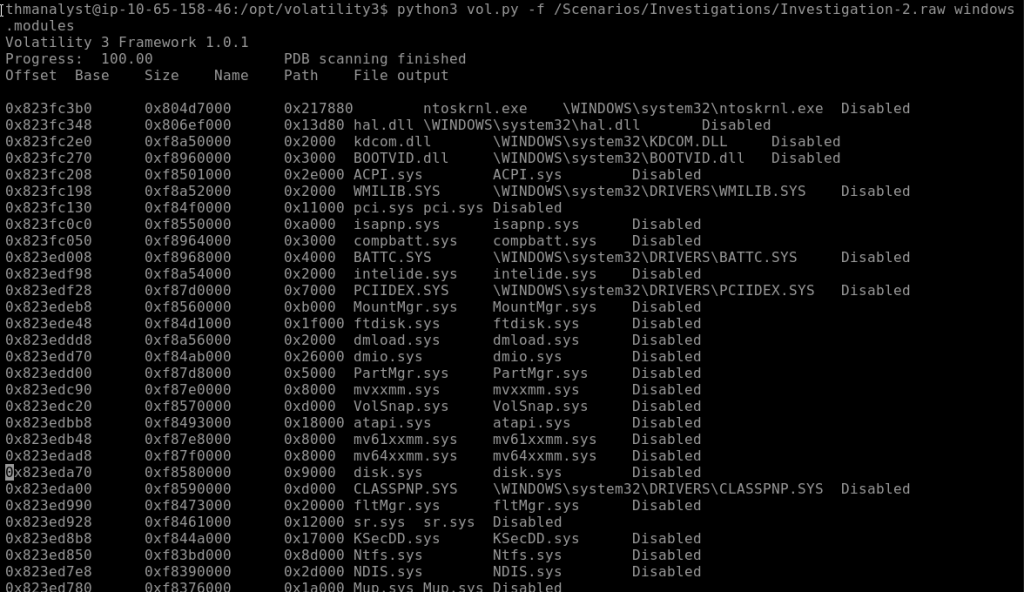
The modules plugin will dump a list of loaded kernel modules; this can be useful in identifying active malware. However, if a malicious file is idly waiting or hidden, this plugin may miss it.
This plugin is best used once you have further investigated and found potential indicators to use as input for searching and filtering.
Syntax: python3 vol.py -f <file> windows.modules“
“The driverscan plugin will scan for drivers present on the system at the time of extraction. This plugin can help to identify driver files in the kernel that the modules plugin might have missed or were hidden.
As with the last plugin, it is again recommended to have a prior investigation before moving on to this plugin. It is also recommended to look through the modules plugin before driverscan.
Syntax: python3 vol.py -f <file> windows.driverscan“

“In most cases, driverscan will come up with no output; however, if you do not find anything with the modules plugin, it can be useful to attempt using this plugin.
As we can see, we get no output with the two files in our VM.
“There are also other plugins listed below that can be helpful when attempting to hunt for advanced malware in memory.”
modscan
driverirp
callbacks
idt
apihooks
moddump
handles
Note: Some of these are only present on Volatility2 or are part of third-party plugins. To get the most out of Volatility, you may need to move to some third-party or custom plugins.”
On to Task 10, Practical Investigations! Time to apply what we have learned.
Case 001 – BOB! THIS ISN’T A HORSE!
Your SOC has informed you that they have gathered a memory dump from a quarantined endpoint thought to have been compromised by a banking trojan masquerading as an Adobe document. Your job is to use your knowledge of threat intelligence and reverse engineering to perform memory forensics on the infected host.
You have been informed of a suspicious IP in connection to the file that could be helpful. 41.168.5.140.
The memory file is located in /Scenarios/Investigations/Investigation-1.vmem
“What is the build version of the host machine in Case 001?”

“At what time was the memory file acquired in Case 001?”

“What process can be considered suspicious in Case 001?
Note: Certain special characters may not be visible on the provided VM. When doing a copy-and-paste, it will still copy all characters.”

“What is the parent process of the suspicious process in Case 001?”
For reader_sl.exe, we see a PPID of 1484. Now running pstree, we can locate the PID of 1484 to see that it belongs to explorer.exe.
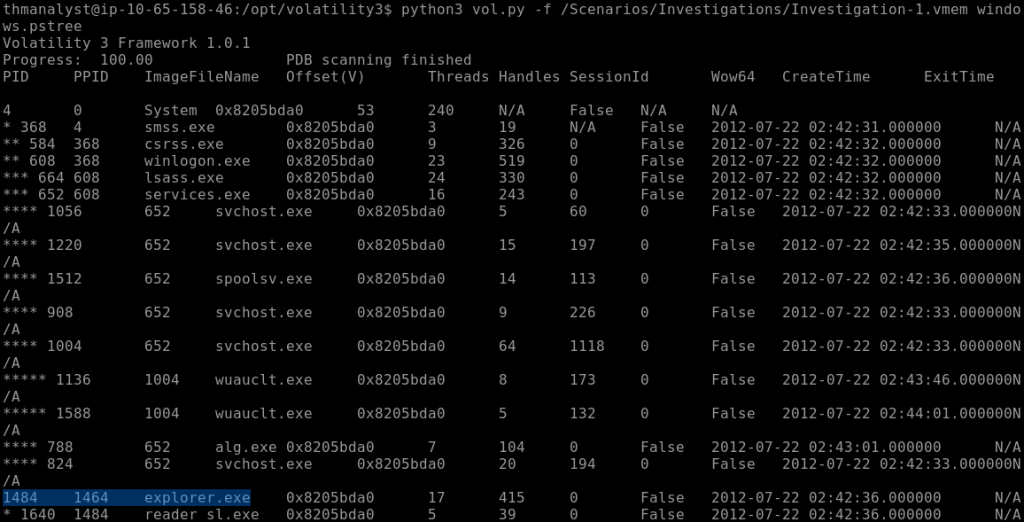
“What is the PID of the suspicious process in Case 001?”
1640
“What is the parent process PID in Case 001?”
1484
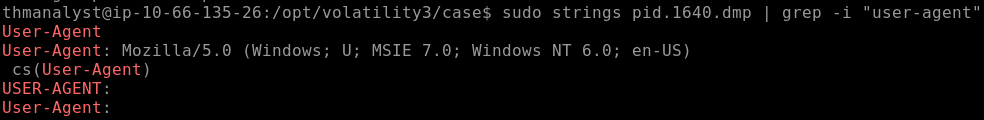
“What user-agent was employed by the adversary in Case 001?”
cd /opt/volatility3
mkdir -p case
Using the command: python3 vol.py — help we see this plugin we can use.

Use the command:
python3 vol.py -f /Scenarios/Investigations/Investigation-1.vmem -o case windows.memmap.Memmap –pid 1640 –dump
After this is dumped to the case file, you can run the head command ‘sudo cat pid.1640.dmp | head’ to see the string output. In order to see the user-agent, we will make it simpler by running the strings command: sudo strings pid.1640.dmp | grep ‘user-agent’

“Was Chase Bank one of the suspicious bank domains found in Case 001? (Y/N)”
Y

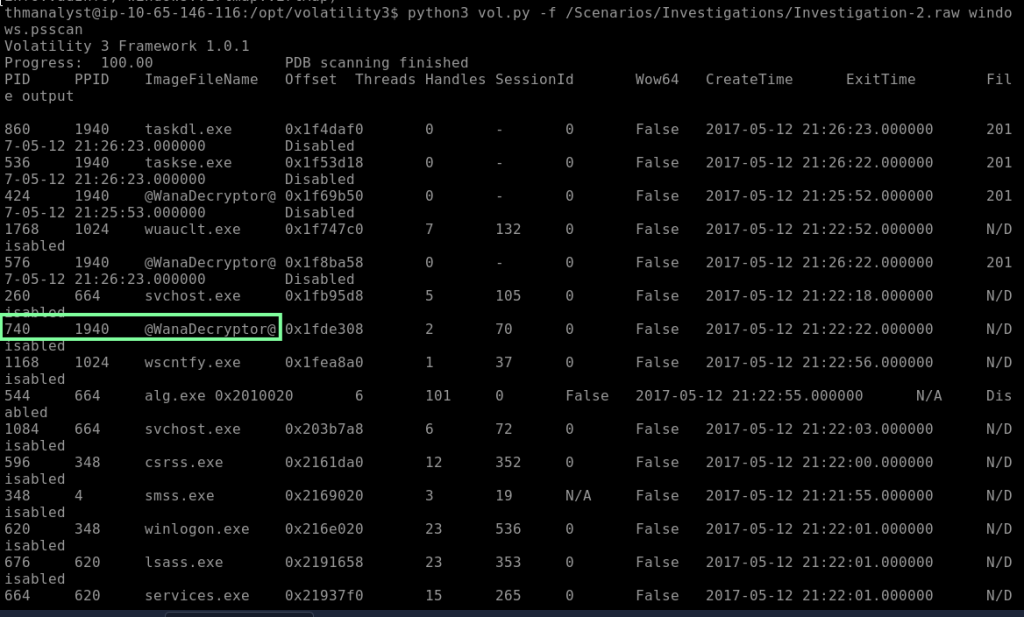
“What suspicious process is running at PID 740 in Case 002?”
Now we are focusing on Investigation-2.raw. For the first question, I will be using the command: python3 vol.py -f /Scenarios/Investigations/Investigation-2.raw windows.psscan
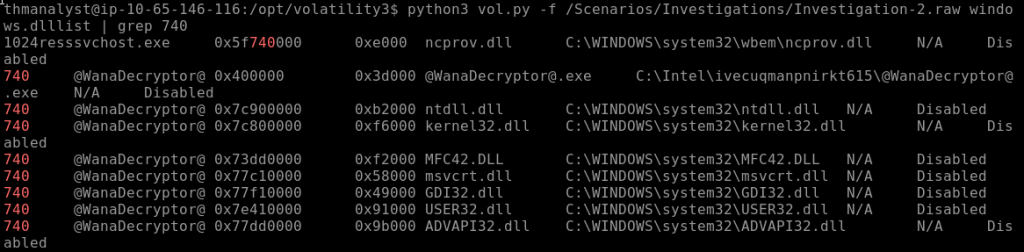
“What is the full path of the suspicious binary in PID 740 in Case 002?”
I add windows.dlllist | grep 740 as the plugin now. We are looking for the first one: C:\Intel\ivecuqmanpnirkt615@WanaDecryptor@.exe
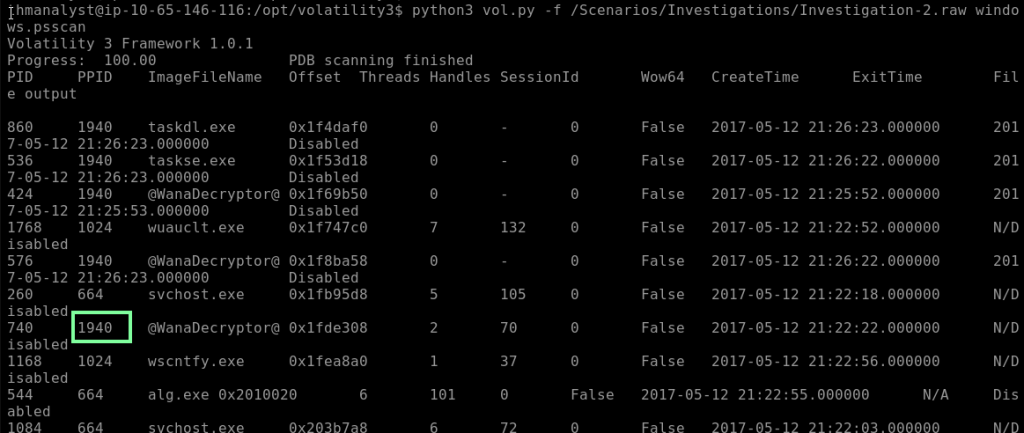
“What is the parent process of PID 740 in Case 002?”
Running windows.psscan again, we see our PPID(the answer to the next question btw!). With that, let’s run the pstree to see the filename.
“What is the suspicious parent process PID connected to the decryptor in Case 002?”
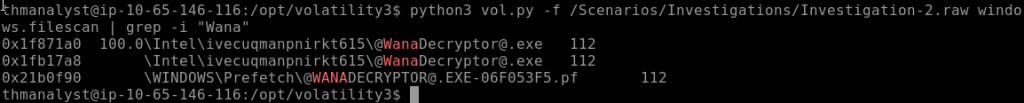
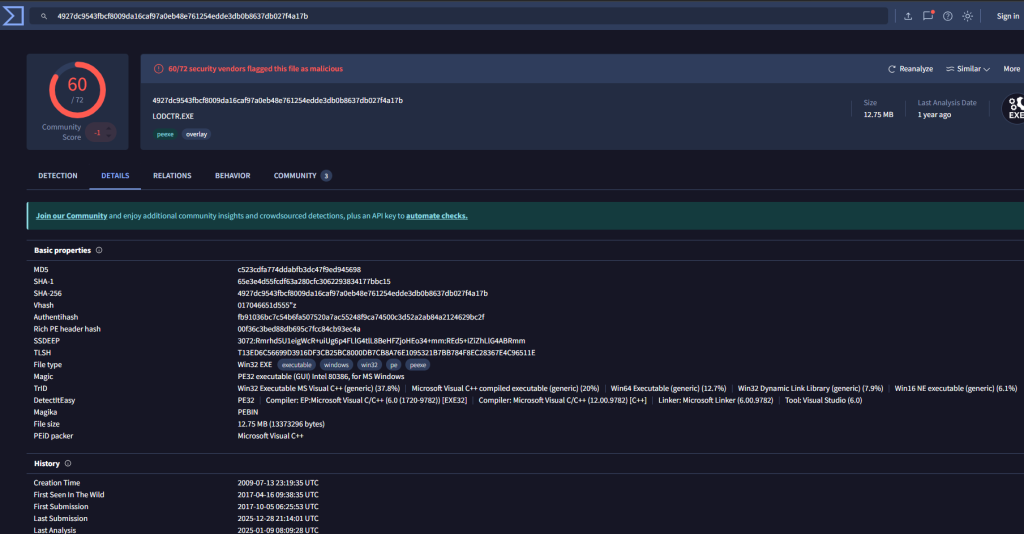
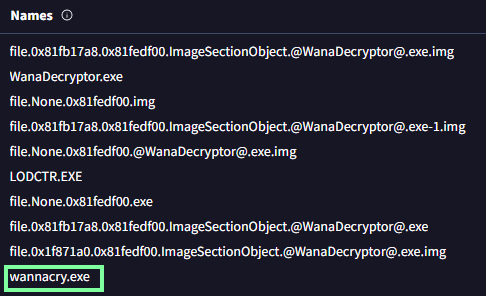
“From our current information, what malware is present on the system in Case 002?”
We need to obtain the file’s hash to submit to VirusTotal.
Using the plugin of “windows.filescan | grep -i “Wana” yields the file’s address/offset as 0x1f871a0.
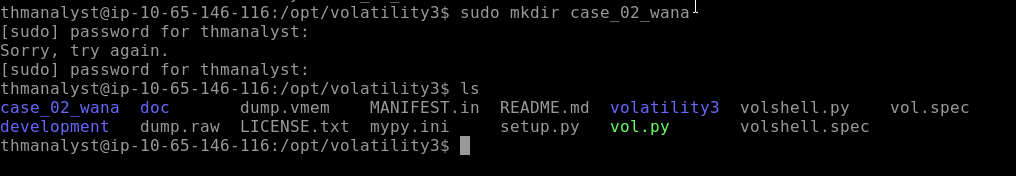
I went ahead and made a new dir called case_02_wana so I could dump the file.
I lost my connection my VM to obtain the snippets for this workflow, but here are the steps and commands I used to obtain the answer:
Now to use the following command to dump the file:
sudo python3 vol.py -f /Scenarios/Investigations/Investigation-2.raw -o /case_02_wana windows.dumpfiles –pid 740
When you cat case_02_wana, you will see a few files:
file.0x81f87f08.0x81fdd008.ImageSectionObject.msls31.dll.img file.0x81fb17a8.0x81f87b00.DataSectionObject.@WanaDecryptor@.exe.dat file.0x81fb17a8.0x81fedf00.ImageSectionObject.@WanaDecryptor@.exe.img, etc. but what you want is the img one.
Use command
sudo md5sum file.0x81fb17a8.0x81fedf00.ImageSectionObject.@WanaDecryptor@.exe.img
To get: c523cdfa774ddabfb3dc47f9ed945698
“What DLL is loaded by the decryptor used for socket creation in Case 002?”
Per https://www.researchgate.net/figure/Dynamic-Link-Libraries-DLLs-invoked-by-WannaCrys-worm-component_tbl2_332028948
by Vassilios Vassilakis

“What mutex can be found that is a known indicator of the malware in question in Case 002?”
Using the windows.handles | grep 1940 plugin.

“What plugin could be used to identify all files loaded from the malware working directory in Case 002?”
Using python3 vol.py –help…

Github link to the volatility tool workflow:
https://github.com/volatilityfoundation/volatility/wiki(opens in new tab)